Multiple Regression Analysis by Python statsmodels
Overview
In this article, there is a explanation of Multiple Regression Analysis by using statsmodels in python. We focus not analyzing but understanding how to use this library.
Environments
- Python 3.8.6
- statsmodels 0.13.2
Preparetion of datase
This time we will use Red Wine Quality dataset. This dataset is published as OpenDatabase License in kaggle site. We download it and save the csv file in any directory.
Installing statsmodels
By using pip command, we will install the statsmodels library.
pip install statsmodelsLoading dataset
Next, we will load the dataset you save in any directory by pandas dataframe.
import pandas as pd
df = pd.read_csv('winequality-red.csv')
df.head()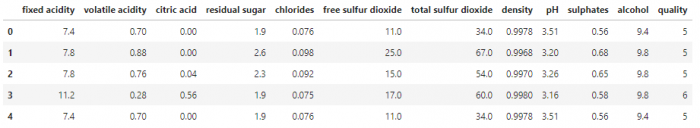
In this dataset, we can see “quality” is a responsive variable and others are explanatory variables.
Multiple Regression Analysis
Now, we move on to Muitiple Regression Analysis for this dataset. However statsmodels is so powerful that we don’t need to write lots of code.
import statsmodels.api as sm

#Explanatory columns
X = df[df.columns[:-1]]

#Adding constant term
X = sm.add_constant(X)

#Responsive variable
y = df['quality']

#Generating a model
model = sm.OLS(y,X)
result = model.fit()

#Checking results
result.summary()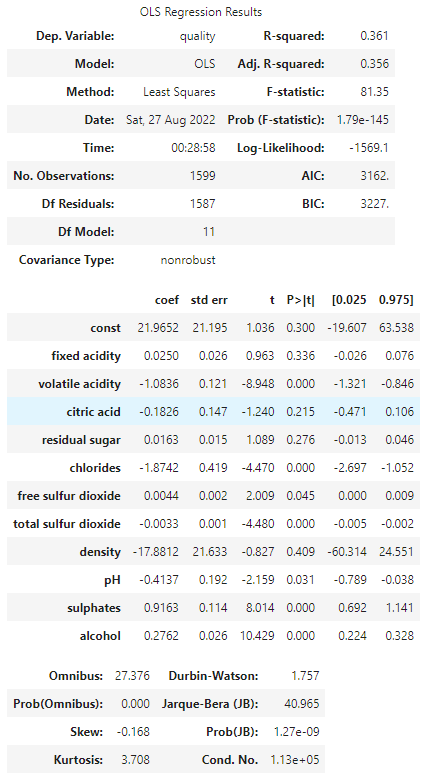
The meaning of results
The meaning of the results is important for us so lets check them.
Dep. Variable
This is the responsive variable we selected, quality in here.
Model
The type of modes is showed. OLS means Ordinary Least Sqauares. This method is quite common.
Method
Method is almost same as Model, Least Squares.
Date, Time
The date and time we got the OLS results. It means when we executed result.summary().
No. Observations
The number of rows in dataet. Here it is same as a result of len(df), 1599.
Df Residuals
This is Degree of freedom of Residuals. it can be caluculated as No.Observations minus Df Model minus 1. 1599 – 11 -1 = 1578
Df Model
This is Degree of freedom of Model. It is number of explanatory variables, 11.
Covariance Type
The covariance Type is nonrobust as default.
R-squared
This is squared of Coefficient of Determination.
Adj. R-sqaured
This is squared of Adjusted Coefficient of Determination. Adj. R-sqaured can be used for comparison between two models having different explanatory variables.
F-statistic
F-static can be used to test whether there are meaningul explanatory variables.
Prob (F-statistic)
This is probability of F-statistic. It is enough small value in this example.
Log-Liklihood
Log-Liklihood can evaluate likelihod of data samples.
AIC
This is Akaike’s Information Criterion. Smaller is better.
BIC
This is Bayesian information criterion. Smaller is better.
Summary of this article
statisticmodels can make results of multiple regression quite easily. However when we work on any real tasks, it is also good idea to use any other libralies to show data graphially.